Your cart is currently empty!

Infographics ROI
People love infographics. They’ve gone from a trend to a basic, and the 63.4 million infographics in Google images tell you something about their popularity.
But there are those who question the value of infographics. Here are some of the points made by the naysayers:
- Poor quality infographics are all over the web, lessening the value.
- Infographics are not always readable to search engines.
- Links from embeddable infographics may be devalued by Google.
These aren’t such strong points, when you think about them. For the first concern, don’t use poor quality infographics and you will be part of the solution. As for infographics and SEO, the real value is in actual links to your infographic from people who enjoy it, and in clicks through to your website from sharing of the infographic — not from the infographic itself.
And there are some strong points in favor of infographics:
- They make information easier to understand, especially quantitative data which many people find hard to grasp.
- They make numbers more interesting and entertaining than they are in a table.
- They are more likely to be saved and shared than a simple chart.
But do infographics really pay their way?
First it depends what they cost
Professional infographics typically cost $300-$900 as of this writing, depending on the amount of research involved. This is far less than the cost of a video, but more than the cost of a blog post. Plus, you need a good amount of text to go with it, because of the SEO limitations mentioned above. So you should think of a custom infographic as a content investment, like a white paper, rather than thinking of it the way you think of the stock photo bought for a daily blog post.
Use infographics as part of your overall content strategy and have a plan for what to do with them. Then you can determine the value of the infographics and the ROI required. Compare the costs of various options (hiring a specialized infographics firm, having them done by your graphics people, turning your interns loose at Piktochart.com…) and determine which price point makes sense for you.
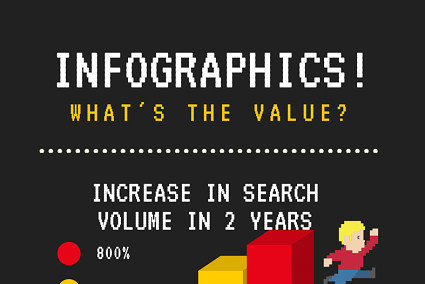
There will be probably be a difference in quality. Let’s have a look at a couple of custom-made infographics by me (info) and Jay (graphic):
And here are a couple I’ve made with online tools:
For me, creating my own graphics makes sense if I can do it fast and it doesn’t have to be a work of art — that is, when I’m using it for a blog illustration. If I have bigger plans for it, or if we’re building one for a client, then I will always get the info together and send it to Jay. His infographics are works of art.
You can also use stock infographics and embeddable infographics — that is, infographics which have been designed to be shared by their creators — in blog posts if you find something that works with your message. They may be branded with someone else’s brand, and they can’t be used in as many ways as your custom infographic can be, but they are likely to be less expensive.
Then it depends on your return
What’s the return on your infographic? Here are some metrics that can help you determine that:
- traffic from the infographic on social media to the article or blog post it’s in
- frequency with which it’s shared, repinned, or retweeted
- conversion rate for calls to action on the infographic’s page
- percentage of bloggers or journalists who use it when you reach out
If you know your baselines for these things, it’s easy to determine whether infographics perform better than ordinary graphics. That is, you should be able to see that your infographic is in your top ten retweeted posts for the week or that the conversion rate on the infographic landing page is 14% higher than usual.
If you don’t know your baselines, do A/B testing with the infographic in half the landing pages (for example) and a photo in half. They can help you determine whether to continue investing in infographics, whether higher-priced infographics perform better than those that require less investment, or what kind of infographics perform best for you.
Then be sure to use commissioned infographics everywhere — in presentations, brochures, emails, and everywhere else you can use a graphic. Since you commissioned it, it belongs to you and you want to get as much value as possible from it.
by
Tags:


Leave a Reply