Your cart is currently empty!

FB Insights: Virality and Reach
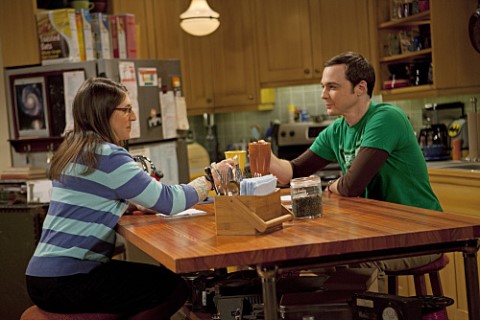
In The Big Bang Theory: Herb Garden Germination, physicist Sheldon and his girlfriend Amy decide to do a little research on Dawkins’s meme theory. Amy tells party girl Penny, “Sheldon and I engaged in sexual intercourse. In other news, I’m thinking of starting an herb garden. Mum’s the word. Gotta go.” She and Sheldon are testing a hypothesis that titillating news will spread more virally than a more mundane announcement.
Hint: they’re right.
In their social circle, they can feel pretty confident that sex will interest everyone more than gardening, and sure enough, the false news spreads throughout the group within 24 hours. At your company website, it may not be such an easy call. How can you tell whether details about your new product will be more thrilling to your audience than an upcoming sale or a company-wide controversy?
Facebook Insights has a measure of virality that can give you an idea. As soon as your page gets 30 Likes, you’ll see the Insights overview on your Admin panel:

Click through and you’ll see more information. Specifically, you’ll see your total Likes (the number of people who have clicked on “Like”); the total number of friends of all your fans added together, which constitutes the theoretical number of people who might see your posts if all your fans shared them; the number of people who’ve taken action with any of your posts in the past week; and the Weekly Total Reach, which is the number of people who have seen any of your content during the week, including ads and promoted stories.

You get green up arrows if the numbers are increasing and red down arrows if the numbers have gone down since the previous week. As a rule, you want to see up arrows. You’ll also see a line chart if you like to get a quick visual image of how things are going.
Look below the chart and you’ll see measures of reach, engagement, “talking about this,” and virality for each recent post. Reach and “talking…” are the same as above, while engagement refers to clicks on the post.


Virality measures the percentage of visitors who took an action such as sharing your post. Click on the word at your insights page to sort your posts by virality, with the most viral at the top of the list.

We mostly see virality levels of 1 to 5%. However, if you have very small numbers of visitors you might have much higher levels — say, if all three of your visitors shared the post, in which case you’d have 100% virality. As always, larger numbers give you more useful data.
If your numbers are large enough, look at the posts that have higher levels of virality. A quick glance at all our pages showed that questions and pictures tend to have higher levels of virality, broadly speaking. Each page, however, shows its own pattern. What’s yours?
Once you know, see if you can align that virality with visits to your website, sales or other conversions, new Likes, or other metrics. If you can, you have good reason to increase the types of posts that had greater virality. Even if they include herb gardening.
by
Tags:
Comments
2 responses to “FB Insights: Virality and Reach”
Another great article. Even I haven’t dug that deep into FB insights! Have shared on our Echo! and FB pages. Keep up the good work!
Thanks!

Leave a Reply