One of the persistent problems with social media marketing is the difficulty of measuring its effectiveness. A new tool called Social Crawlytics is trying to help with that.
Social Crawlytics takes a different approach from other social media monitoring tools: it doesn’t look at the reach of your tweets or the number of Likes you’ve amassed, but at how the content at your website is shared.
This gives it one immediate advantage: it doesn’t get bogged down in vanity metrics. Another advantage: you can use the tool on your competitors’ sites as well.
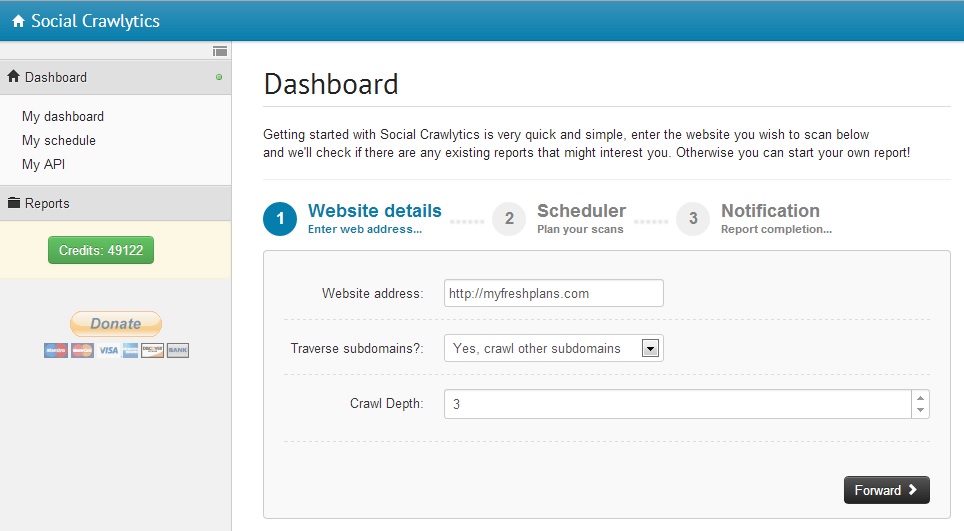
To give it a try, just go to SocialCrawlytics.com and sign up for 5,000 free credits. You’ll then put in the URL of the website you want to crawl, plus optional reporting details if you want automatic crawls in the future. You can see those screens above and below (click to see more detail). Step 3 is “Notification” — provide your email address so you can be alerted when your report is ready.
Social Crawlytics now checks how your website has been shared in social media. You’ll initially see a nearly empty screen like the one below, so don’t be alarmed.
The report shows you which social media platforms are responsible for most of the sharing. Our lab site, Fresh Plans, has some shares at Twitter, Facebook, Google +, and Delicious, but 80% of the sharing our readers have done has been on Pinterest. For our website here at Haden Interactive, Pinterest is the least important, behind Twitter, Facebook, G+, and then LinkedIn. Look at charts for a few different websites and you’ll see how pointless those discussions about whether LinkedIn is more important than Twitter are — it differs from one site to another.
On the other hand, if your competitors are making great use of Pinterest and you are not, you might want to look and see what they do that you don’t.
You’ll see total numbers, top authors, and the pages being shared most. In the example below, we can see that our page of monkey lesson plans has been the most shared lately, with 237 pins. We can also watch LinkedIn and Stumble Upon, though they have too little juice to show up in the charts.
You can also see whether images or text are being shared most often — that’s the ring on the left in the screenshot below. Though Pinterest is the top sharing source, it’s text (red) that is most often shared, not images. This is good news for us — we want people to click through and read the text. Our yellow “unknown” slice is probably video.
The blue ring is your “Sunburst Tree.” Click through and you’ll see the shares according to site architecture. For this site, for example, we can see how many people share from pages in our main navigation, how many from pages they found by searching in a category, how many from the general blog page, etc.
This report could tell you how much your individual products are shared, for example.
Note that this doesn’t track only our shares — this shows sharing by readers as well. That differentiates this tool from most social media tracking tools. Check it out and let us know what you think!


Leave a Reply